Demo Strategy Metrics That Predict Revenue Outcomes
Measure conversions between demo request and booked meeting, not just views and completion rates.
Most demo dashboards measure whether a demo happened, not whether it moved a deal. Views, completion rates, time-on-page: these numbers climb with traffic and satisfy a weekly report, but they don't answer the one question a revenue team actually needs answered, which is whether a given demo changed a buyer's trajectory toward a purchase. That gap between exposure and intent is not a minor measurement quirk. Per a Marketing Week survey cited in Agility CMS research, 39.7% of companies rarely or never measure how much their campaigns actually drive growth, and demo metrics are a small, specific version of that same blind spot.
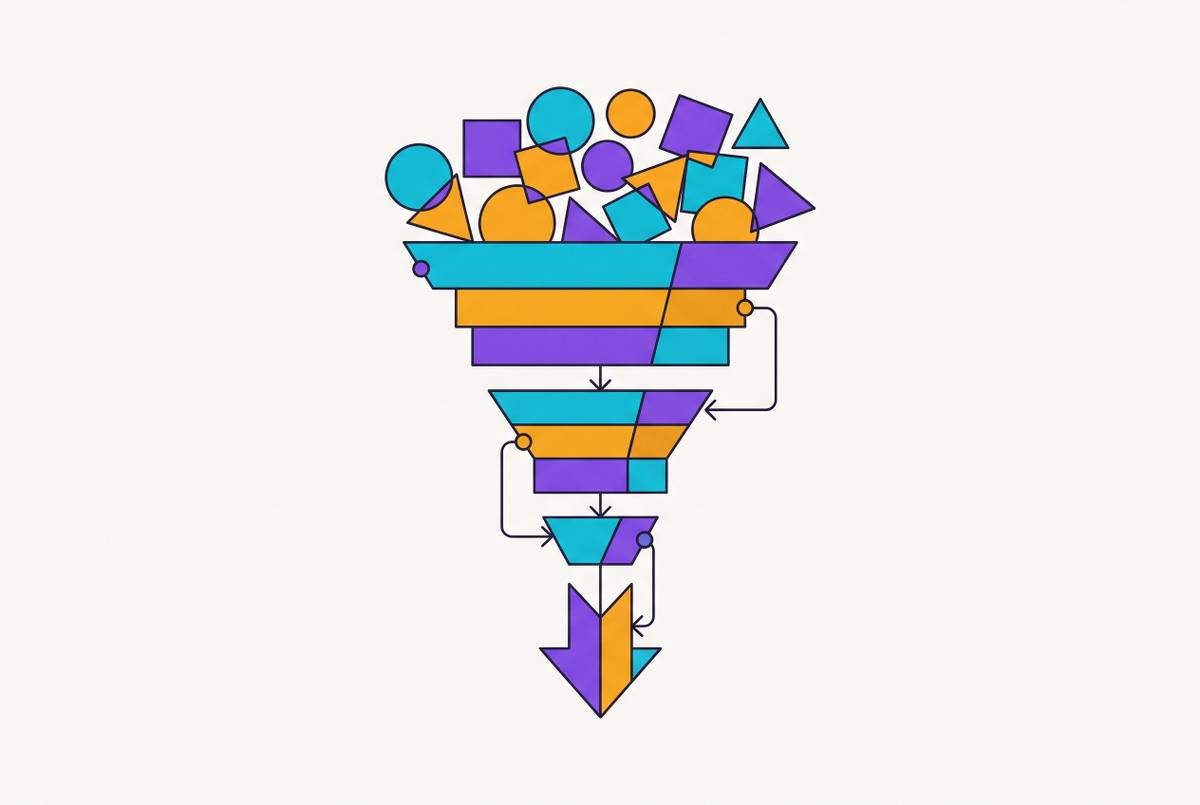
The two conversion rates between those three stages carry the most predictive weight for downstream revenue. Lead Qualification Rate, the move from Demo Request to Qualified Lead, tells a team whether its targeting is accurate; Demo-to-Meeting Conversion Rate, the move from Qualified Lead to Booked Meeting, tells a team whether friction or lack of urgency is bleeding potential deals before they start. Chili Piper's 2024-to-2025 data makes the dependency between these stages concrete: disqualification rate fell significantly across that period while qualified-to-booked improved by a smaller margin, meaning whole-funnel yield improved almost entirely because of upstream qualification gains, invisible to anyone watching only the second rate. At the stage where MQL converts to SQL, the typical range runs 15% to 21%, and per 2025 B2B SaaS funnel data from The Digital Bloom, a 5 percentage-point gain at that bottleneck alone can lift overall revenue by as much as 18%.
A metric earns a place in a revenue conversation when it correlates with what happens after the demo: pipeline created, deals closed, revenue booked. A metric that only correlates with more people watching the demo is not predictive, it's just popular. This piece builds out which metrics belong in the first category, and why.
Which funnel stages and conversion rates between demo request, qualified lead, and booked meeting are most predictive of revenue?
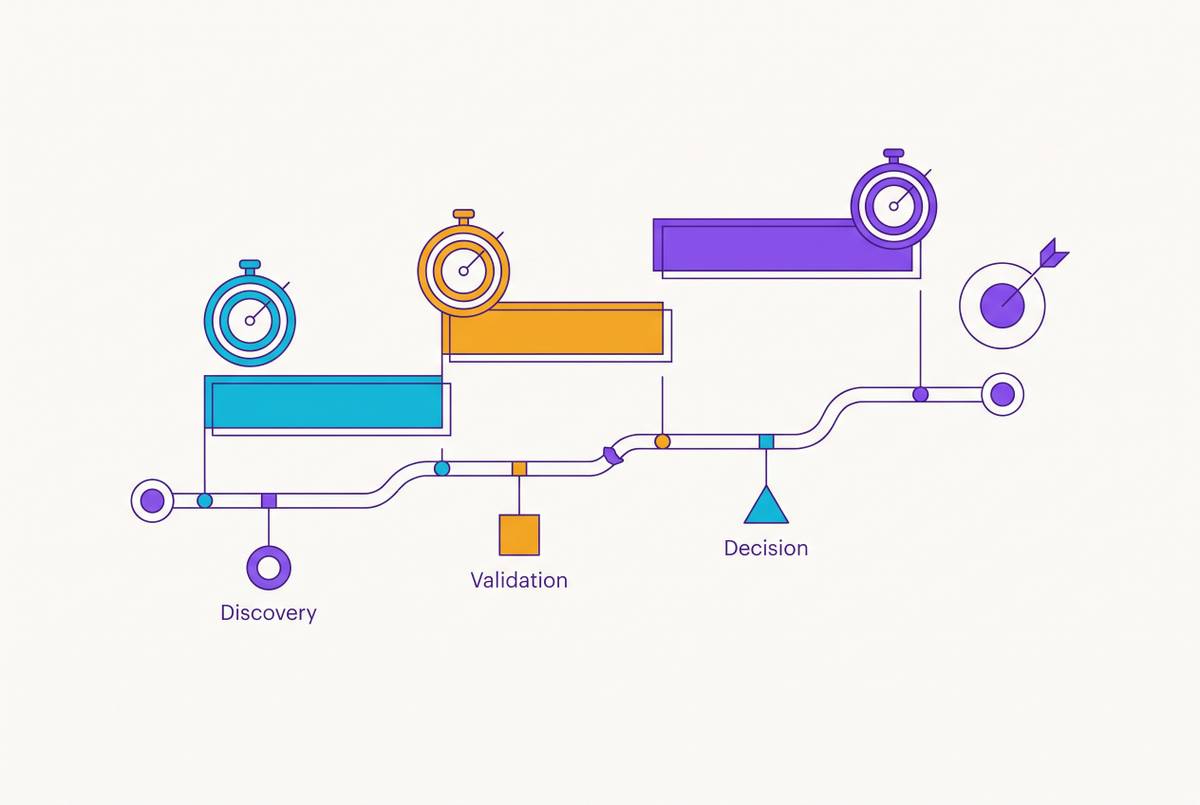
Every demo request moves through three stages. First, a prospect submits a form (Demo Request). Second, someone evaluates that submission against ideal customer profile and sales-readiness criteria (Qualified Lead). Third, the qualified lead actually books and shows up for a discovery or product call (Booked Meeting).
Between those three stages sit two rates that do the real diagnostic work. Lead Qualification Rate, the move from Demo Request to Qualified Lead, tells a team whether its targeting is accurate and whether the leads coming in are worth anyone's time. Demo-to-Meeting Conversion Rate, the move from Qualified to Booked, tells a team whether there's friction in the booking process or a lack of urgency once someone's been deemed a fit.
Here's the catch: a demo funnel is really several measurements stitched together, not one headline rate. Reading a single conversion number in isolation, without the stages around it, leads to conclusions that are flat wrong.
Chili Piper's own numbers make the case well. Between its 2024 and 2025 reports, disqualification rate fell significantly, while the qualified-to-booked rate improved by a comparatively smaller margin. Someone watching only that second rate would have missed the story entirely. Whole-funnel yield improved meaningfully, driven almost entirely by better qualification upstream, and that improvement was invisible to anyone staring at just one number in the chain.
There's a second wrinkle worth naming early: interactive, self-guided demos and live demos are not measured the same way, structurally. A self-guided product tour never creates a scheduled-meeting event, so its completion rate has no honest comparison point against a booking or attendance rate from a live call. Different formats need different baselines. Before a team adds a single new metric to its dashboard, it needs to agree on which funnel it's actually looking at.
The conversion benchmarks that give predictive metrics their context
Demo request rate is a useful starting signal, since it's one of the higher-intent actions a visitor can take on a B2B site. Complex B2B SaaS sites convert around 1.1% overall, which is why a demo request, a much narrower and more deliberate action, deserves closer attention than a generic form fill.
Optifai's Sales Ops Benchmark, drawn from 939 companies across Q2 2025 through Q1 2026, puts the average B2B demo-to-close rate at 25%. That number splits out in useful ways. By industry, SaaS closes at 30%, Professional Services at 22%, Manufacturing at 20%. By segment, SMB closes at 32%, Mid-Market at 25%, Enterprise at 18%. By deal size, anything under $10K closes at 35%, the $10K to $50K range at 28%, $50K to $100K at 22%, and $100K-plus deals at 15%.
The MQL-to-SQL step is where a lot of pipelines quietly stall. That conversion typically runs 15% to 21%, and per 2025 B2B SaaS funnel data from The Digital Bloom, pushing that stage up by just 5 percentage points can lift overall revenue by as much as 18%. Small movement at a bottleneck stage, outsized effect downstream.
Enterprise and SMB deals also close at different rates for structural reasons: enterprise opportunity-to-close sits around 31%, SMB around 39%. Enterprise cycles run longer and involve more people, which means more demo touchpoints per deal, and that's exactly why engagement signals gathered across those touchpoints carry more predictive weight for enterprise pipelines than for SMB ones.
None of these numbers are targets to hit. They're diagnostic baselines. A gap between an internal rate and the relevant benchmark points a finger at exactly which stage deserves the next hour of investigation.
Engagement depth signals that separate browsers from buyers
Passive engagement confirms a demo got seen. Play rate and total views live in this bucket, and they're the easiest numbers to pull, which is exactly why they show up on every dashboard by default. Active engagement is a different animal: interactions per user, replays, time spent per step, steps that get skipped. These numbers reveal what a buyer actually cared about, not just that they clicked play. Platforms built for product education content are designed around exactly this distinction between passive viewing and meaningful interaction.
Analysis of tens of thousands of demos across thousands of teams surfaces a handful of engagement signals worth building around. Replays on a specific section signal one of two things: strong interest, or confusion that needs addressing in the next call. Both are worth acting on, just in different ways. Time spent per step matters too. Where dwell time spikes, that's either high-value content landing well, or a point of friction where the buyer got stuck.
Drop-off points work the same way in reverse. A step where users consistently bail is either irrelevant to that audience or sits right before a key value moment the buyer never reached. Skipped steps are their own signal: they show which content a buyer considers beside the point for their use case, which is itself a personalization cue worth feeding back into demo design.
Account-level interaction data may be the single strongest predictor available. When multiple people at the same company engage with the same demo, that's buying committee activation happening in real time, not just one curious individual poking around. Gartner's 2024 research puts the average buying committee at multiple stakeholders, and asynchronous demo sharing across a group that size is a structural advantage for the seller, provided someone's actually tracking engagement at the account level instead of the user level.
Drop-off and skip data shouldn't just feed demo redesigns. They're a prioritization list for what to bring up in the next follow-up call.
Conversion signals inside the demo that predict pipeline readiness
Lead capture rate, the share of demo viewers who submit information through an in-demo form, measures something narrower and more useful than general interest: it measures the demo's ability to produce a high-intent lead, not just an engaged visitor. Goal completion rate goes a step further, tracking the share of users who complete the intended action, whether that's scheduling a call, signing up, or downloading something. This is the metric tied directly to business outcomes, not a proxy for them.
Click-through rate on embedded calls-to-action adds a third layer. It separates people who watched the demo from people who acted on what they saw, and the ratio between CTR and goal completion tells a team whether the demo's value case is actually landing or just being politely tolerated.
Format matters more than most teams assume. Per Optifai's benchmark data, interactive demos convert at 38%, a substantial improvement over screen share. Walnut's platform data, drawn from thousands of B2B sales engagements, shows interactive demos driving 32% higher conversion compared to traditional static or live-only formats. Content quality aside, the format itself is a conversion variable, and it's one a team can change without rewriting a single slide.
Stage matters just as much. A demo built for the awareness stage of a buyer's journey will underperform its own benchmarks when served to someone already in decision mode, and vice versa, regardless of how well it's built.
None of this matters if sales is slow to respond. Chili Piper research found that responding to a demo request within the first minute increases conversion by 391%. Every in-demo signal discussed above is only as valuable as the speed with which someone on the sales team acts on it.
Personalization depth as a compounding revenue variable
The relationship between personalization and conversion doesn't move in a straight line, it compounds. Walnut's 2025 data shows teams that personalize 50% or more of their demos seeing conversion lifts north of 40% compared to teams running generic templates. That's not a marginal gain, that's a different category of outcome.
McKinsey's 2024 B2B Pulse Survey backs this up at the strategy level: leaders in personalization pull in 40% more revenue from those efforts than the laggards.
Inside a demo, personalization takes a few concrete forms. It means tailoring the flow to a buyer's industry, role, or a pain point they've already named. It means running multi-stakeholder demos that speak to different personas sitting on the same buying committee, rather than one generic script for everyone. And it means letting MEDDIC-style qualification determine which demo path a given prospect actually sees. Per Optifai's 2025 to 2026 data, top performers hit demo-to-close rates above 40%, well clear of the 25% baseline average.
Audience insight data, demographics, technographics, segmentation by user and account, stops being a reporting artifact once personalization enters the picture. It becomes an input: tracking which segments engage most deeply tells a team which demo flow to build next, not just which one to report on this quarter.
That has a direct measurement consequence. Teams running personalized demos need to track conversion by variant, not just in aggregate. A single blended completion rate hides which specific personalization choice is doing the work and which one is dead weight.
Revenue attribution: connecting demo engagement data to closed-won outcomes
Revenue impacted sits at the top of this whole framework: total revenue attributed to conversions traced back to a demo. It's the metric that ties demo performance to actual business outcomes instead of funnel activity that may or may not matter.
Most teams can't make that connection today. Demo engagement data usually lives outside the CRM, in a separate tool with its own login, which means nobody can trace a specific engagement back to a specific closed deal. CRM-integrated demo analytics closes that gap directly, per Walnut's platform research, letting revenue teams connect demo engagement straight through to pipeline and closed-won figures instead of guessing at the link.
Customer expansion is a second attribution track worth tracking separately from new-logo acquisition: the share of existing customers who engage with demos of new features. That number measures the demo's role in upsell and retention, a different job than the one new-business demos are doing.
Cost per lead from demo, the cost of building and distributing a demo divided by leads generated, lets a team weigh demo investment against every other line item in the demand gen budget on equal footing. Pipeline velocity is worth watching alongside it: this KPI tracks how fast deals move through the funnel by factoring in deal size, win rate, and cycle length, and a healthy number here signals both an efficient process and real underlying demand, per Querio's 2025 Sales and Marketing KPI guide.
Scale matters here too. G2 data shows organizations running a formal sales enablement strategy hit a 49% win rate on forecasted deals, against 42.5% for those without one. That 6.5 point gap works out to roughly $650,000 in added revenue on a $10 million pipeline, which is the kind of number that turns an attribution argument from a nice idea into a budget line.
Win rate by source rounds this section out: tracking which demo format, channel, or variant closes at the highest rate lets a team shift production investment toward whatever's actually returning the most, instead of whatever's easiest to make more of.
Building a demo metrics stack that a revenue team will actually use
Not every metric belongs in front of every person. Splitting them by decision type keeps the dashboard from turning into noise.
Deal-level decisions, the ones about which prospects to prioritize this week, need interactions per account, replays, goal completion rate, and lead capture rate. Program-level decisions, about which demo assets deserve more investment, need completion rate by variant, drop-off by step, and conversion rate by format. Strategy-level decisions, about where demo fits in the broader revenue model, need revenue attributed, pipeline velocity contribution, win rate by source, and CPL measured against every other channel in the mix.
A goal like "improve demo performance" doesn't survive contact with a pipeline review. Something like "move demo-to-meeting conversion from its current rate to a defined target by a set date" does, because it's tied to a specific stage in the funnel and a specific number to hit.
Dashboards should surface the right tier to the right person, not everything to everyone. A sales rep needs account-level engagement signals in front of them before a call, not a pipeline velocity chart. A RevOps leader needs the attribution and win-rate view. A content team needs step-level drop-off data to know what to rebuild next.
One trap worth naming again: interactive demo metrics and live demo metrics don't belong on the same trend line. A completion rate from a self-guided product tour and an attendance rate from a live call are measuring different behaviors entirely, and blending them into one chart produces a number that means nothing.
Demo engagement data needs to show up in pipeline reviews, not just sit in a marketing report nobody in sales reads. A metric only generates revenue once it triggers an action from someone carrying a quota.
Tracking engagement trends over time helps surface which accounts show high-engagement patterns that might otherwise go unnoticed, turning what used to be reactive follow-up into something closer to proactive outreach. That capability connects to a production question too: teams that can build multiple personalized demo variants quickly, across roles, industries, and languages, generate more variant-level data to act on. A generic demo produces a generic signal. The production bottleneck and the measurement bottleneck turn out to be the same problem, just viewed from opposite ends.