Measuring Demo Program ROI for B2B SaaS Revenue Teams
Revenue Per Demo connects demo activity to closed-won dollars that budgets actually require.

A CFO looking at next year's budget asks one question about the demo program: how much closed revenue did it produce? Most revenue teams can't answer that directly, because the numbers they track, demo volume and win rate, don't add up to a dollar figure. Volume shows how busy the team has been. Win rate shows what share of demos turned into deals. Neither one tells a CFO what the program is actually worth or whether it's earning its budget back.
The gap gets worse under pressure. The dashboard stays green the whole time. Volume and win rate stay flat even as the economics underneath get worse.
Attribution makes the problem harder to fix later. Most B2B SaaS teams still run on last-touch attribution, a method that hands all the credit to whichever channel touched the deal last, and it ignores everything that happened before it. That approach hands out credit unevenly and produces CAC numbers that fall apart the moment a CFO starts asking where they came from.
Boards now expect capital efficiency on every agenda, and that changes what counts as proof. A demo program has to show closed-won ARR, not pipeline coverage, and not meeting counts. The rest of this piece builds the framework that gets a revenue team from activity numbers to that answer.
Revenue Per Demo as the foundational metric that connects activity to dollars
Revenue Per Demo answers the question volume and win rate can't: take total closed-won revenue from demo-sourced deals and divide it by total completed demos in the same time window. One number folds pipeline quality, execution quality, and the commercial outcome into a single figure a CFO can act on.
The formula is simple: Revenue Per Demo equals Total Closed-Won Revenue divided by Total Completed Demos. The denominator matters more than it looks. It has to be completed demos, not scheduled ones, because no-shows inflate the count and quietly break the math.
Picture two teams that run the same number of demos and post the same win rate. The activity and conversion match, but Revenue Per Demo differs tenfold between them. A win-rate dashboard would show these two teams as identical performers. Revenue Per Demo shows they're nowhere close: a team can celebrate a strong conversion rate for months while deal size erodes underneath it, and nobody notices until the revenue number stops growing.
That's the diagnostic power of the metric. Revenue Per Demo falls when win rate holds steady but deal size shrinks, when demo volume climbs but qualification gets loose, or when sales cycles stretch because the wrong stakeholders are sitting in the room. All three problems hide from a volume or win-rate view. None of them hide from Revenue Per Demo.
Getting a clean read requires one thing from the CRM: a clear path from Demo Date to Opportunity to Stage to Closed-Won Amount. Pull a random sample of demo records, and if outcomes or next steps are missing, you already have broken attribution, so the number can't be trusted until you fix that. On timing, you should run the calculation quarterly at minimum, matched to the average sales cycle length plus 30 days. If a cycle runs past 60 days, monthly tracking produces too much noise.
What demo-to-close benchmarks say about where a program stands
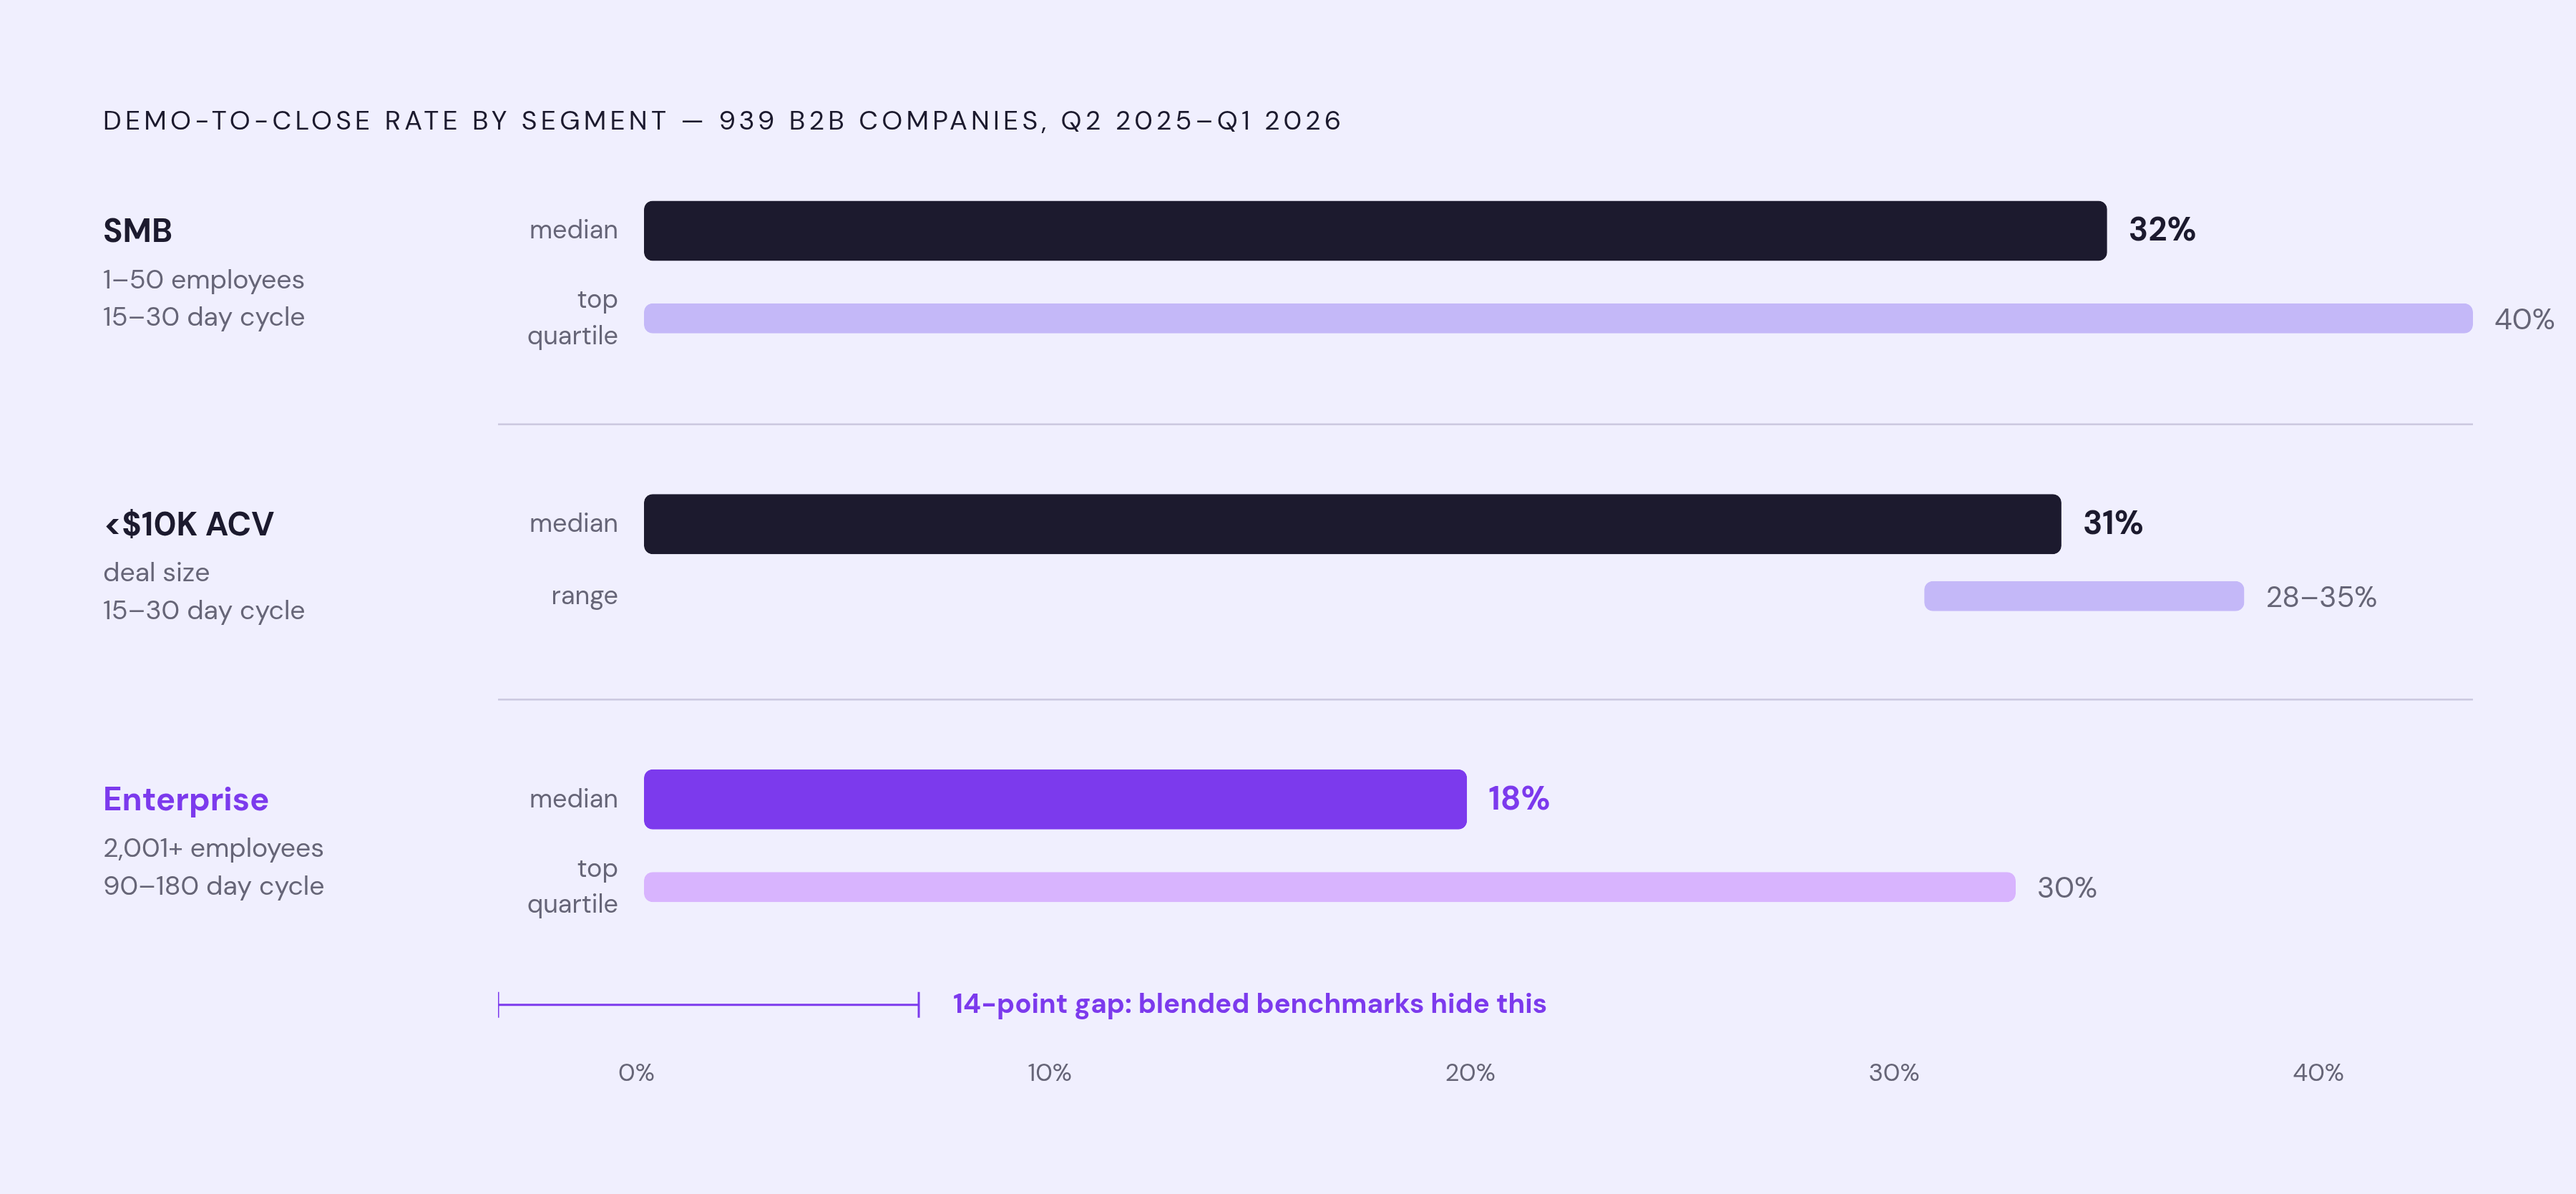
Demo-to-close rates swing too much by segment, deal size, and industry for one blended number to mean much. The real value comes from putting a program against the right peer group, and a dataset covering 939 B2B companies tracked between Q2 2025 and Q1 2026 gives that peer group some shape.
By company size, SMB accounts (1 to 50 employees) post a median close rate of 32%, with top-quartile programs clearing 40% or more on a 15 to 30 day cycle. Enterprise accounts (2,001 or more employees) median at 18%, with 30% as the top-quartile mark, on a cycle that stretches 90 to 180 days. Deals under $10K in annual contract value close around 31%, in a range between 28% and 35%, moving fast on a 15 to 30 day cycle with just one to three stakeholders in the room.
The decline in close rates as deal size and company size grow tracks with how many people now sit in the buying committee. Enterprise deals route through more decision-makers than SMB or mid-market deals do, and every additional stakeholder is another chance for a demo to stall or get re-litigated. That's the backdrop these benchmarks sit against, not a separate problem to solve here.
The benchmarks also expose a leak before the demo ever happens. The median qualified-to-booked conversion rate is 62%; close to four in ten qualified leads never make it to a meeting. Left unaddressed, that gap skews Revenue Per Demo calculations, because the demos that do happen aren't a clean sample of the pipeline that qualified.
Motion matters as much as segment. If you measure an outbound program against inbound benchmarks, you'll flag a healthy program as broken, simply because you judged it against the wrong comparison.
The six operational drivers that determine how much revenue each demo produces
Revenue Per Demo moves because of six operational drivers working together, not because of one cause. Fix one and the metric improves. Ignoring several at once makes the losses stack.
Qualification quality decides whether a demo reaches an account that can buy at the target deal size. The fix is tightening ICP criteria inside the booking flow and requiring firmographic data before a prospect can get a slot on the calendar.
Average deal size is the single biggest lever in the math. Watch for average deal size trending down quarter over quarter, or reps discounting just to get a signature.
The format of the demo itself changes conversion. A static "book a demo" form converts 1% to 3% of visitors. A live AI-driven demo converts 6% to 20%, because it closes the distance between a prospect's intent and an actual hands-on experience of the product.
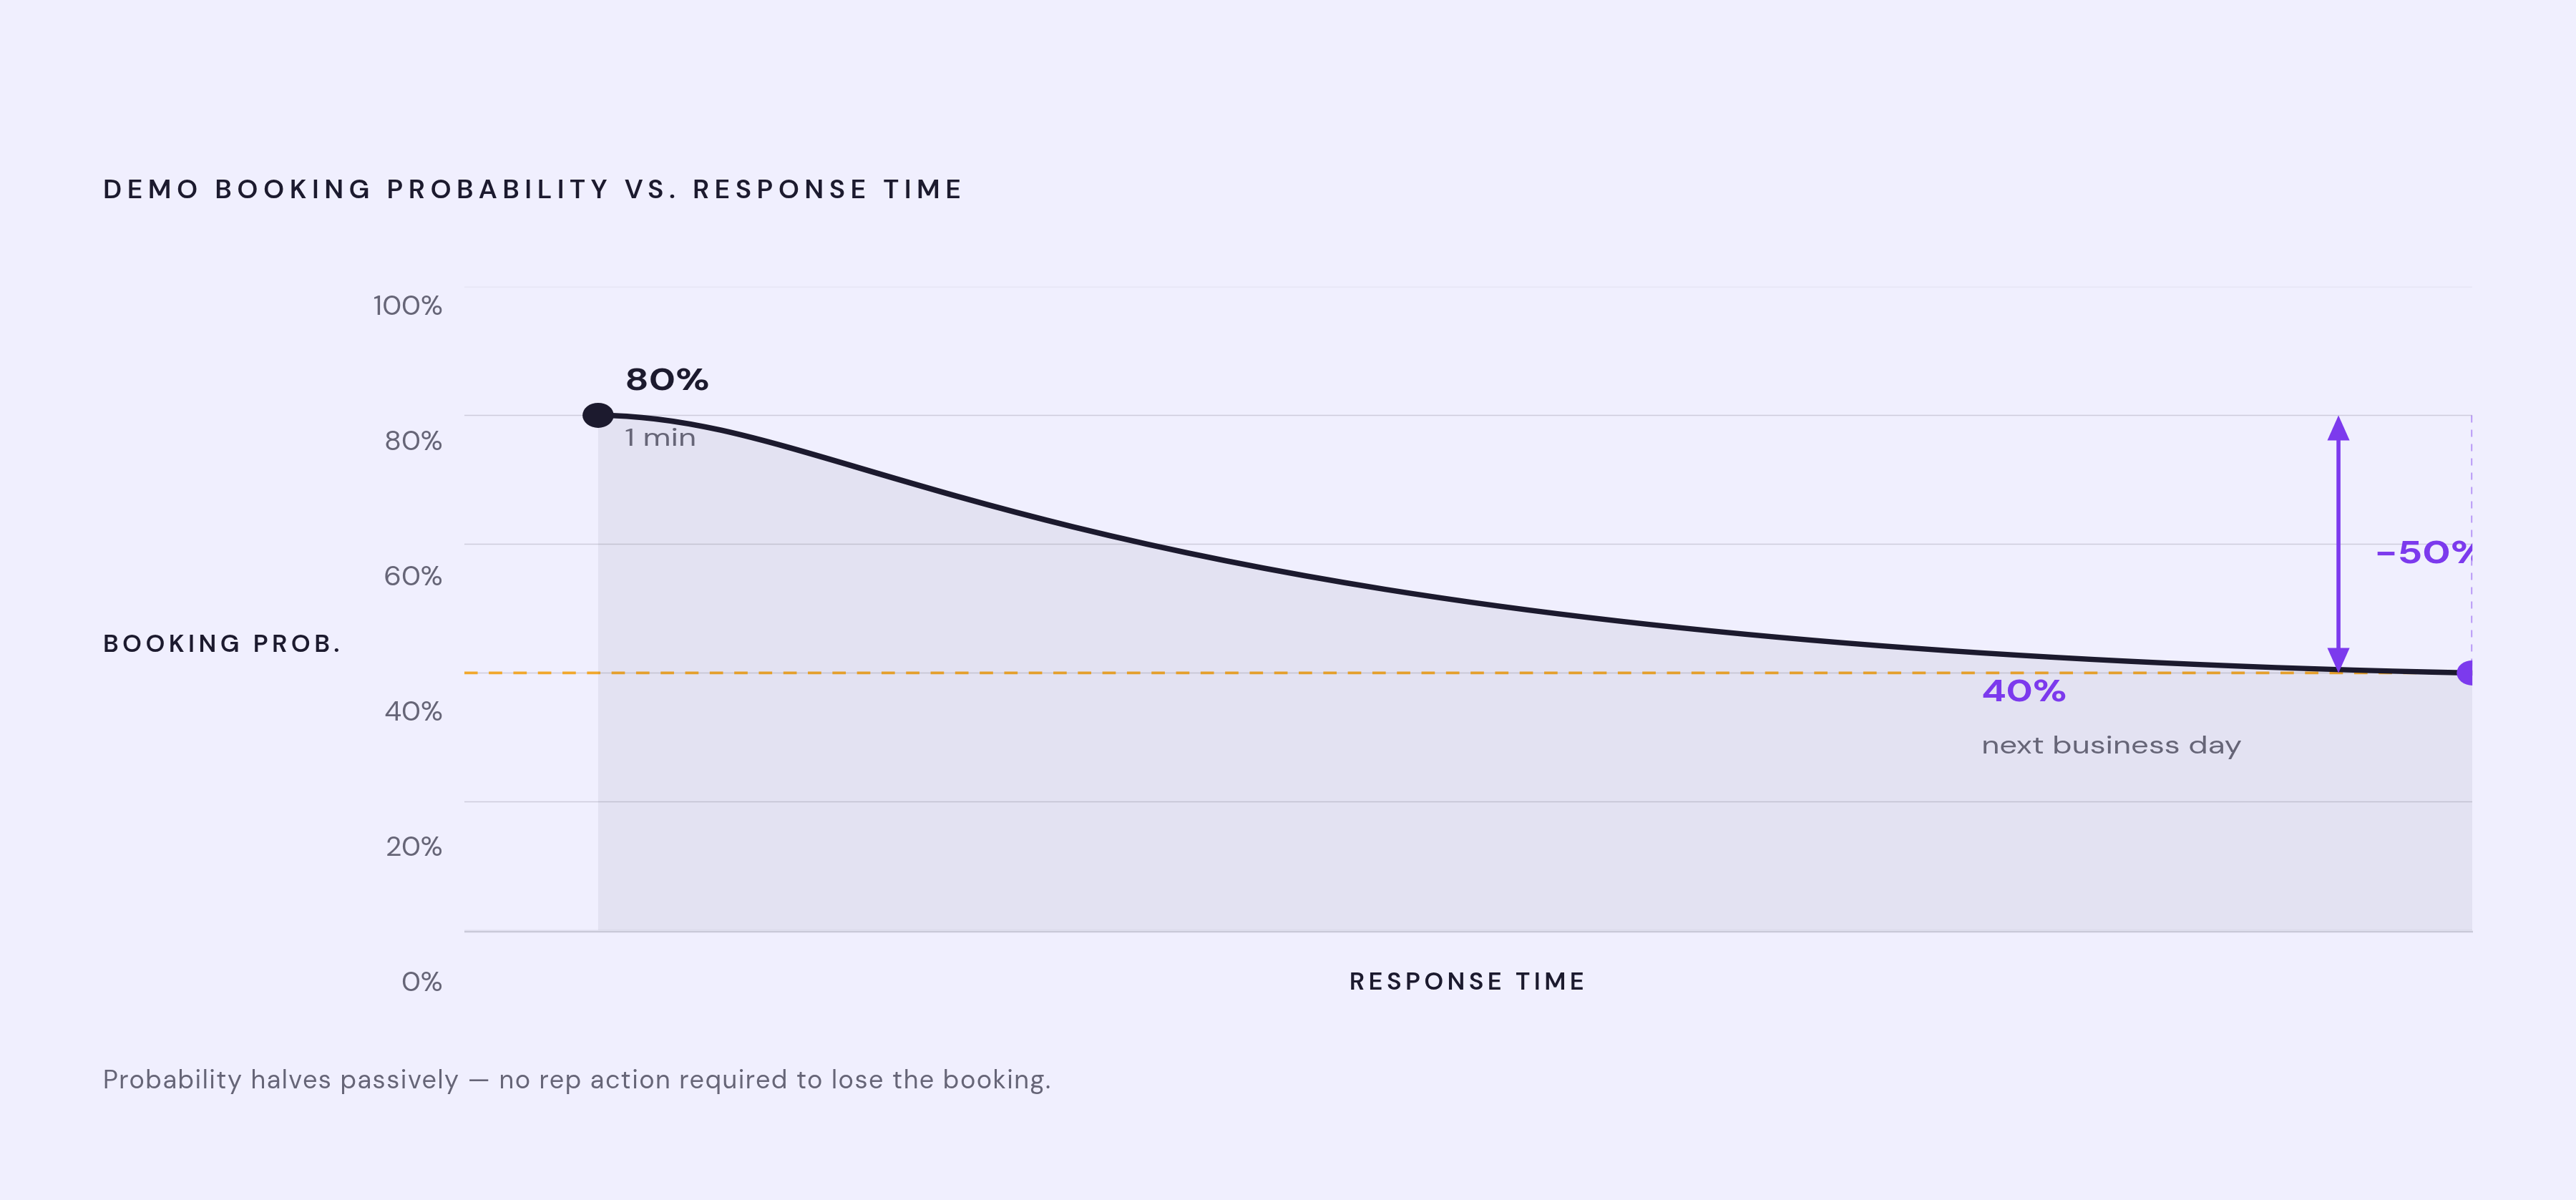
Sales cycle velocity runs on speed-to-lead. Booking probability starts around 80% in the first minute after a form submission and falls to roughly 40% by the next business day, which turns response time into one of the cheapest levers a team has.
Multi-threading, or buying-group penetration, measures how much of the actual decision-making group a team has reached. Deals that stay single-threaded churn faster and close less often, because if one champion leaves or goes quiet, the whole thing can stall.
A team with weak qualification, falling deal size, and low completion rates together can still post a close rate that looks acceptable on the surface while Revenue Per Demo drops quarter after quarter underneath it.
One driver that teams consistently underuse is the demo asset itself. A single, well-produced interactive demo built around a feature launch can go into the launch announcement, the email blast, the in-app notification, and the enablement deck at the same time, with no extra production work, extending reach across the buying committee and shortening the sales cycle because stakeholders who weren't on the original call can still watch the exact same demo instead of waiting for a live re-run, which is the practical bottleneck AI-assisted video tools like Clueso are built around: producing a narrated, captioned demo walkthrough fast enough and clean enough to send to the full buying group, without needing a dedicated video production team behind it.
Building a CFO-ready attribution model that ties demo touchpoints to closed ARR
A Revenue Per Demo number is only trustworthy if the attribution is right, because last-touch models misstate which demo touchpoint actually moved the deal forward.
A CFO-grade model needs three distinct revenue categories. Incremental ARR is the revenue that would not have happened without the demo program at all, and it's the only one of the three that actually answers the CFO's question about causation.
Leading B2B SaaS organizations apply these three categories through a triangulated, three-layer approach. Holdout or geo experiments confirm that the revenue being attributed is caused by the program.
Holdout testing is the one method that isolates cause from correlation directly: it compares a treatment group that went through the demo program against a control group that didn't. Running one takes scale, and it means giving up some conversions in the control group for the length of the test, but it's the answer that holds up when a CFO pushes back hardest.
None of this works without an honest cost input. Fully-loaded CAC has to include salaries, commissions, tooling, content production, and allocated overhead, not just media spend. Counting media spend alone can understate true CAC by more than half.
That cost input feeds CAC payback period: fully-loaded CAC divided by monthly ARPU times gross margin.
All of this needs somewhere to live. A 10-metric GTM dashboard spanning visitor-to-demo through demo-to-close time, each metric with a named owner and a live data source, turns a one-time analysis into something a team checks every week. For a team without any attribution stack in place yet, the starting move is simple: pull 10 closed-won opportunities from last quarter and trace which demo touched each one. If you can't trace that cleanly, you have broken attribution, and Revenue Per Demo won't be reliable until you fix it.
Extending the framework to LTV and churn signals to complete the revenue picture
The strongest ROI argument for a demo program is the retention gap between customers who came in through a demo and customers who came in through a self-serve trial, a gap that compounds across 12, 24, and 36 months into an ARR difference bigger than anything the pre-sale conversion numbers can show.
The reason sits in how each type of customer arrives. A trial-acquired customer usually comes in curious about a feature and sensitive to price. That difference in starting conditions produces a structural gap in retention, visible in cohort data.
This comparison rules out the objection that demo completion and win-rate gains are just correlation from better-fit prospects self-selecting into demos. Retention differences at the 12- and 24-month mark are visible in CRM data without needing a controlled experiment, and the revenue impact of that gap, at a given deal size, is concrete enough to put directly in front of a CFO.
LTV:CAC ratio, segmented by acquisition channel between demo-acquired and non-demo cohorts, is what makes the case land in financial terms. A healthy target for growth-stage SaaS is a CAC payback period of 12 to 18 months, and demo-acquired customers shorten that effective payback because they retain better.
If the same workflow that builds a pre-sale demo walkthrough can also produce the post-sale onboarding video and the SOP article, producing video and documentation becomes a revenue concern directly, compressing both CAC and churn out of a single production motion. Clueso fits this case specifically: it turns screen recordings into polished product videos and step-by-step documentation in the same workflow, which makes a unified pre-sale and post-sale content motion realistic for a team with no dedicated video production staff.
There's a leading indicator to track on the adoption side too. If fewer than 40% of AEs are using an enablement asset within 30 days of its launch, the asset isn't solving the right problem. The same 40% threshold applies on the customer success side to post-sale content.
Translating the full framework into a reporting structure CFOs will act on
A demo program ROI report that will survive a CFO review has to move from demo-stage inputs through closed-won ARR and on to LTV and CAC payback, with a named owner and a data source behind every metric in it. A dashboard of activity numbers with a revenue column bolted on doesn't meet that bar.
The report follows five steps. First, define the revenue types: sourced ARR, influenced ARR, and incremental ARR, scoped specifically to the demo program. Second, calculate fully-loaded CAC, including demo production costs, tooling, AE time, and SE time, not just ad spend or headcount. Fifth, score the channel on the same 10-dimension scorecard used for every other GTM investment: fully-loaded CAC, payback, LTV:CAC, sourced ARR, influenced ARR, incremental ARR, velocity, headcount load, tooling cost, and churn delta.
That framework needs a home a team actually checks. A weekly executive scoreboard, with an owner, a cadence, and a data source attached to each line, should carry Revenue Per Demo, demo-to-close rate by segment, CAC payback by acquisition channel, LTV:CAC by cohort, and the churn rate gap between demo-acquired and non-demo-acquired customers.
If you show both figures side by side, the board gets the full picture of what the program contributed.
The production cost line is where most teams undercount their real CAC. If producing, updating, or localizing demo content takes a production specialist's time or an outside agency's invoice, that cost belongs in the CAC calculation, not off to the side as a sunk marketing expense. The same kind of on-demand documentation can close part of the mid-funnel leak too: if a qualified prospect gets a clear async walkthrough before the live meeting, they show up more often and arrive with fewer open questions.
The report comes down to three questions a CFO needs answered. Did the demo program generate net-new ARR that wouldn't have shown up otherwise? Did demo-acquired customers retain at a better rate than the baseline cohort? And does the LTV:CAC ratio the program produces justify what it fully costs? Answer all three with real numbers, and the conversation with the CFO shifts from defending last quarter's budget to deciding how much more to invest next quarter.